
Statistics and Probability: Mean, Median, Mode and Basic Chance
Learn the three measures of central tendency — the mean, the median and the mode — for both raw and grouped data, the range, the empirical relation between them, and the basics of probability as favourable outcomes over total outcomes for coins, dice and cards. Worked step by step with the exam's data sets and the mistakes to avoid.
By the end of this lesson you will be able to find the mean, median and mode of a set of numbers, handle a grouped frequency set, and work out a simple probability for a coin, a die or a pack of cards, so that you can answer "Find the median of 3, 7, 5, 9, 11" or "What is the probability of drawing a king from a pack?" at once.
Already confident? Practise maths questions
Before this: the mean is the average you already know, so this lesson builds straight on it. If the average feels shaky, read the Average lesson before this one.
The three measures of central tendency
Each gives a different "middle" of a data set.
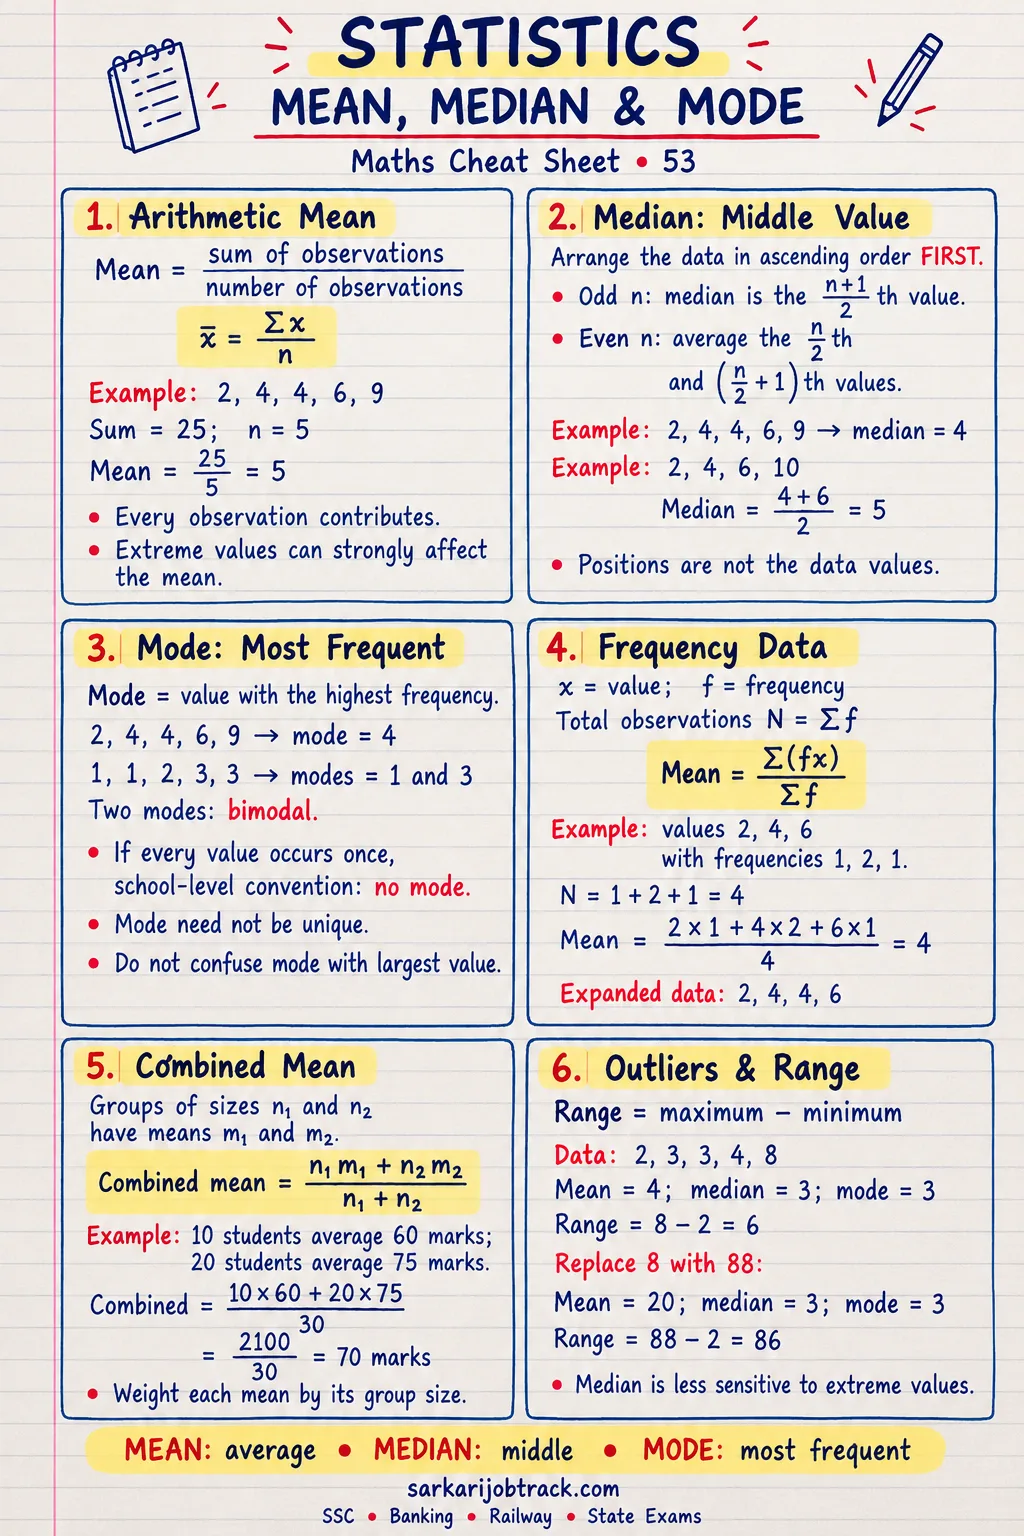
- Mean = sum of all values ÷ number of values.
- Median = the middle value when the data is arranged in order.
- Mode = the value that occurs most often.
Worked example (mean). Find the mean of 4, 8, 6, 10, 2.
- Sum = 4 + 8 + 6 + 10 + 2 = 30; there are 5 values.
- Mean = 30 ÷ 5 = 6.
Worked example (median, odd count). Find the median of 3, 7, 5, 9, 11.
- Arrange in order: 3, 5, 7, 9, 11. With 5 values the middle is the 3rd.
- Median = 7.
Worked example (median, even count). Find the median of 4, 8, 6, 10.
- Arrange: 4, 6, 8, 10. With an even count, average the two middle values.
- Median = (6 + 8) ÷ 2 = 7.
Worked example (mode). Find the mode of 2, 3, 3, 5, 7, 3, 8.
- 3 occurs three times, more than any other value.
- Mode = 3.
Grouped (frequency) data
When each value comes with a frequency f, the mean is the sum of value × frequency divided by the total frequency:
mean = Σ(f × x) ÷ Σf
Worked example. Marks 10, 20 and 30 are scored by 2, 3 and 5 students.
- Σ(f × x) = (10 × 2) + (20 × 3) + (30 × 5) = 20 + 60 + 150 = 230.
- Σf = 2 + 3 + 5 = 10.
- Mean = 230 ÷ 10 = 23.
The range is simply the largest value minus the smallest — a rough measure of spread. For the marks above, range = 30 − 10 = 20.
The empirical relation
For a moderately skewed distribution the three measures are linked:
mode = 3 × median − 2 × mean
So if two are known the third follows.
Worked example. A data set has mean 23 and median 24. Find the mode.
- mode = 3 × 24 − 2 × 23 = 72 − 46 = 26.
Basic probability
The probability of an event is the fraction of outcomes in its favour:
P(event) = favourable outcomes ÷ total outcomes
It always lies between 0 (impossible) and 1 (certain).
A die (6 faces).
- P(an even number) = 3/6 = 1/2 (the evens are 2, 4, 6).
- P(a number greater than 4) = 2/6 = 1/3 (only 5 and 6).
Two coins. The four equally likely outcomes are HH, HT, TH, TT.
- P(exactly two heads) = 1/4 (only HH).
- P(at least one head) = 3/4 (all but TT).
A pack of 52 cards (4 suits of 13; 26 red, 26 black; 12 face cards — J, Q, K in each suit).
- P(a king) = 4/52 = 1/13.
- P(a red card) = 26/52 = 1/2.
- P(a face card) = 12/52 = 3/13.
Common mistakes to avoid
- Finding the median without sorting — the data must be in order first; the median of 3, 7, 5, 9, 11 is 7, not the unsorted middle 5.
- Averaging one value for an even count — with an even number of values the median is the average of the two middle ones.
- Mixing up the empirical relation — it is mode = 3 median − 2 mean, not the other way round.
- Wrong card counts — a pack has 4 kings (P = 1/13) and 12 face cards (not 16; the ace is not a face card).
Quick revision table
| Measure | How to find it |
|---|---|
| Mean | sum ÷ count |
| Median | middle of the ordered data (average the two middle if even) |
| Mode | most frequent value |
| Grouped mean | Σ(f × x) ÷ Σf |
| Range | largest − smallest |
| Empirical relation | mode = 3 median − 2 mean |
| Probability | favourable ÷ total (between 0 and 1) |
| Pack of cards | 52 cards, 4 of each rank, 26 red, 12 face cards |
Keep this and the statistics cheat sheet for revision. These measures are what a data set in Data Interpretation asks you to read, so revise the two together.
How this was made: Drafted with AI assistance; every formula and worked figure recomputed independently.