
Statistics Cheat Sheet
31 Oct 2026
Quick answer
A quick revision cheat sheet on basic statistics for SSC, Banking, Railway and state exams. It covers the three measures of central tendency — mean, median and mode — with their formulas, how to find each for a set of values, the range, and the empirical relationship between mean, median and mode, with worked examples.
Statistics Cheat Sheet
Quick Revision
Statistics begins with the three measures of central tendency — the mean, the median and the mode — each a different way of finding the "centre" of a set of numbers.
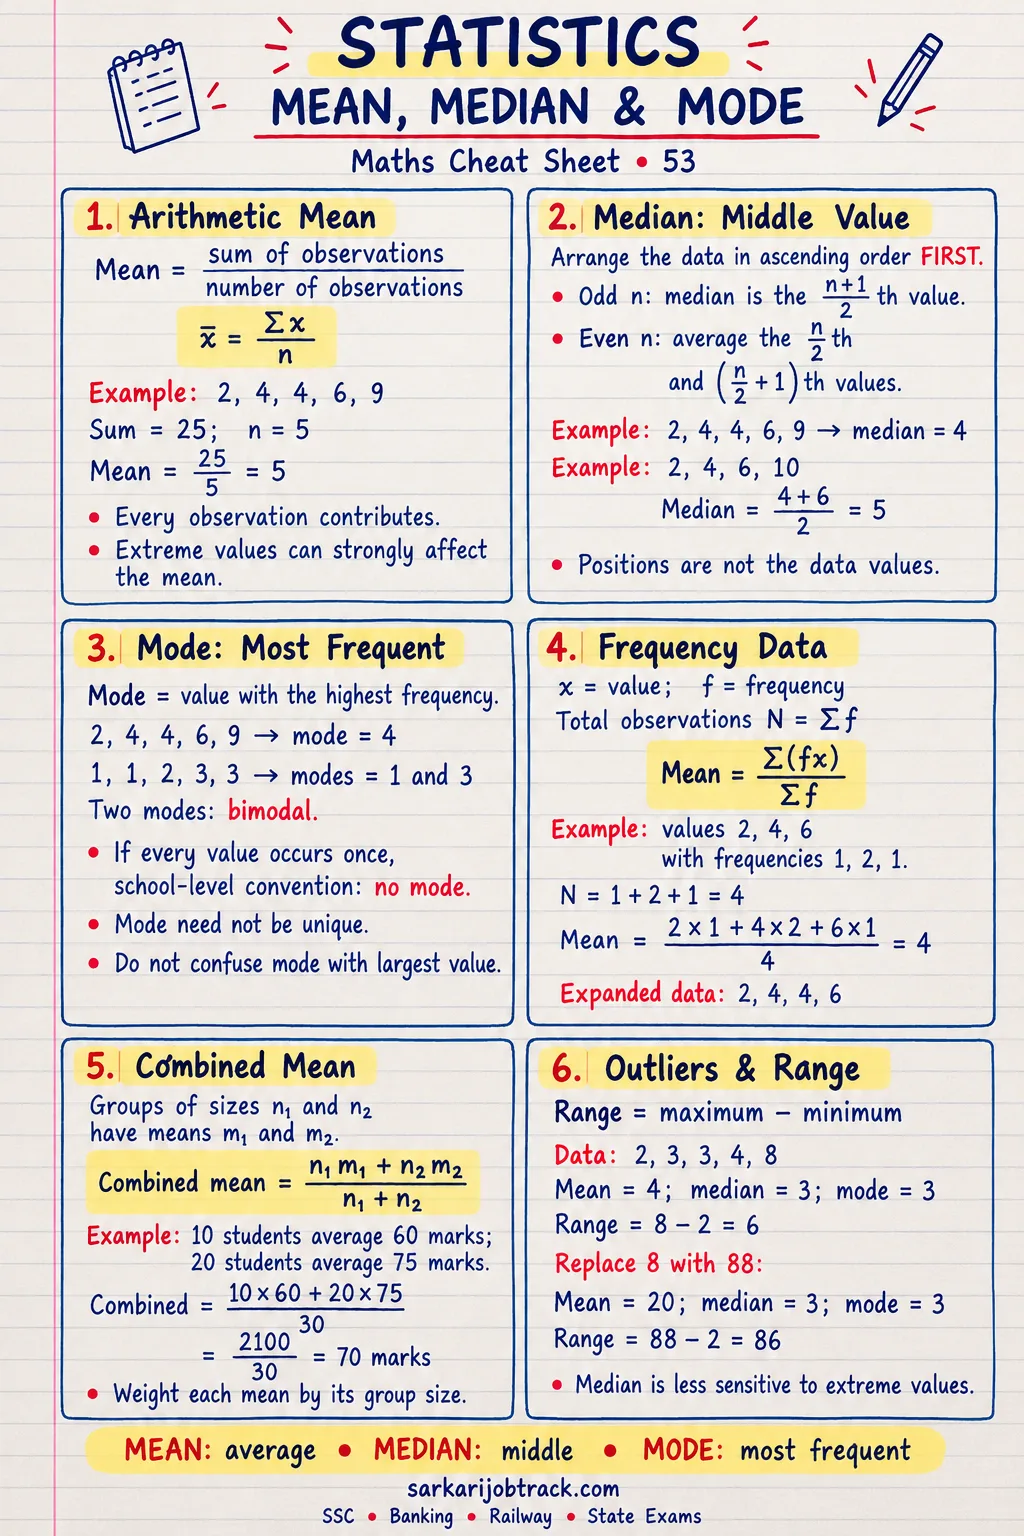
1. Mean (Average)
Mean = Sum of all values / Number of valuesExample
For 4, 8, 10, 14: Mean = (4 + 8 + 10 + 14) / 4 = 36 / 4 = 9.
2. Median (Middle Value)
Arrange the values in order, then:
- Odd number of values → the middle value.
- Even number of values → the average of the two middle values.
Example
For 3, 5, 7, 9, 11 (odd, 5 values): the median is the 3rd value, 7. For 4, 8, 10, 14 (even): median = (8 + 10) / 2 = 9.
3. Mode (Most Frequent)
The mode is the value that appears most often. A set can have one mode, more than one, or none.
Example
For 2, 3, 3, 5, 7, 3, 8: the mode is 3 (it appears three times).
4. Range
Range = Highest value − Lowest valueFor 4, 8, 10, 14: Range = 14 − 4 = 10.
5. Empirical Relationship
For a moderately skewed set, the three measures are linked by:
Mode = 3 × Median − 2 × Mean6. Exam Quick Tips
- Always sort the values before finding the median.
- For an even count, the median is the average of the two middle values.
- A set can have no mode (all values different) or several.
- Remember the empirical link: Mode = 3 Median − 2 Mean.
Keep revising with the rest of the Maths section:
How this was made: Drafted with AI assistance; spot-checked by the editor on 31 October 2026.